THE RESULT
What the data shows
The warehouse reconciles 12,885,358 reported trips into 11,459,171 eligible observations. Future-month duration MAE is 6.12 minutes, 2.9% lower than the route-hour baseline.
The full warehouse and the sampled model evaluation have different scopes. Passenger charges are not profit; deployment decisions need fleet and dispatch data.
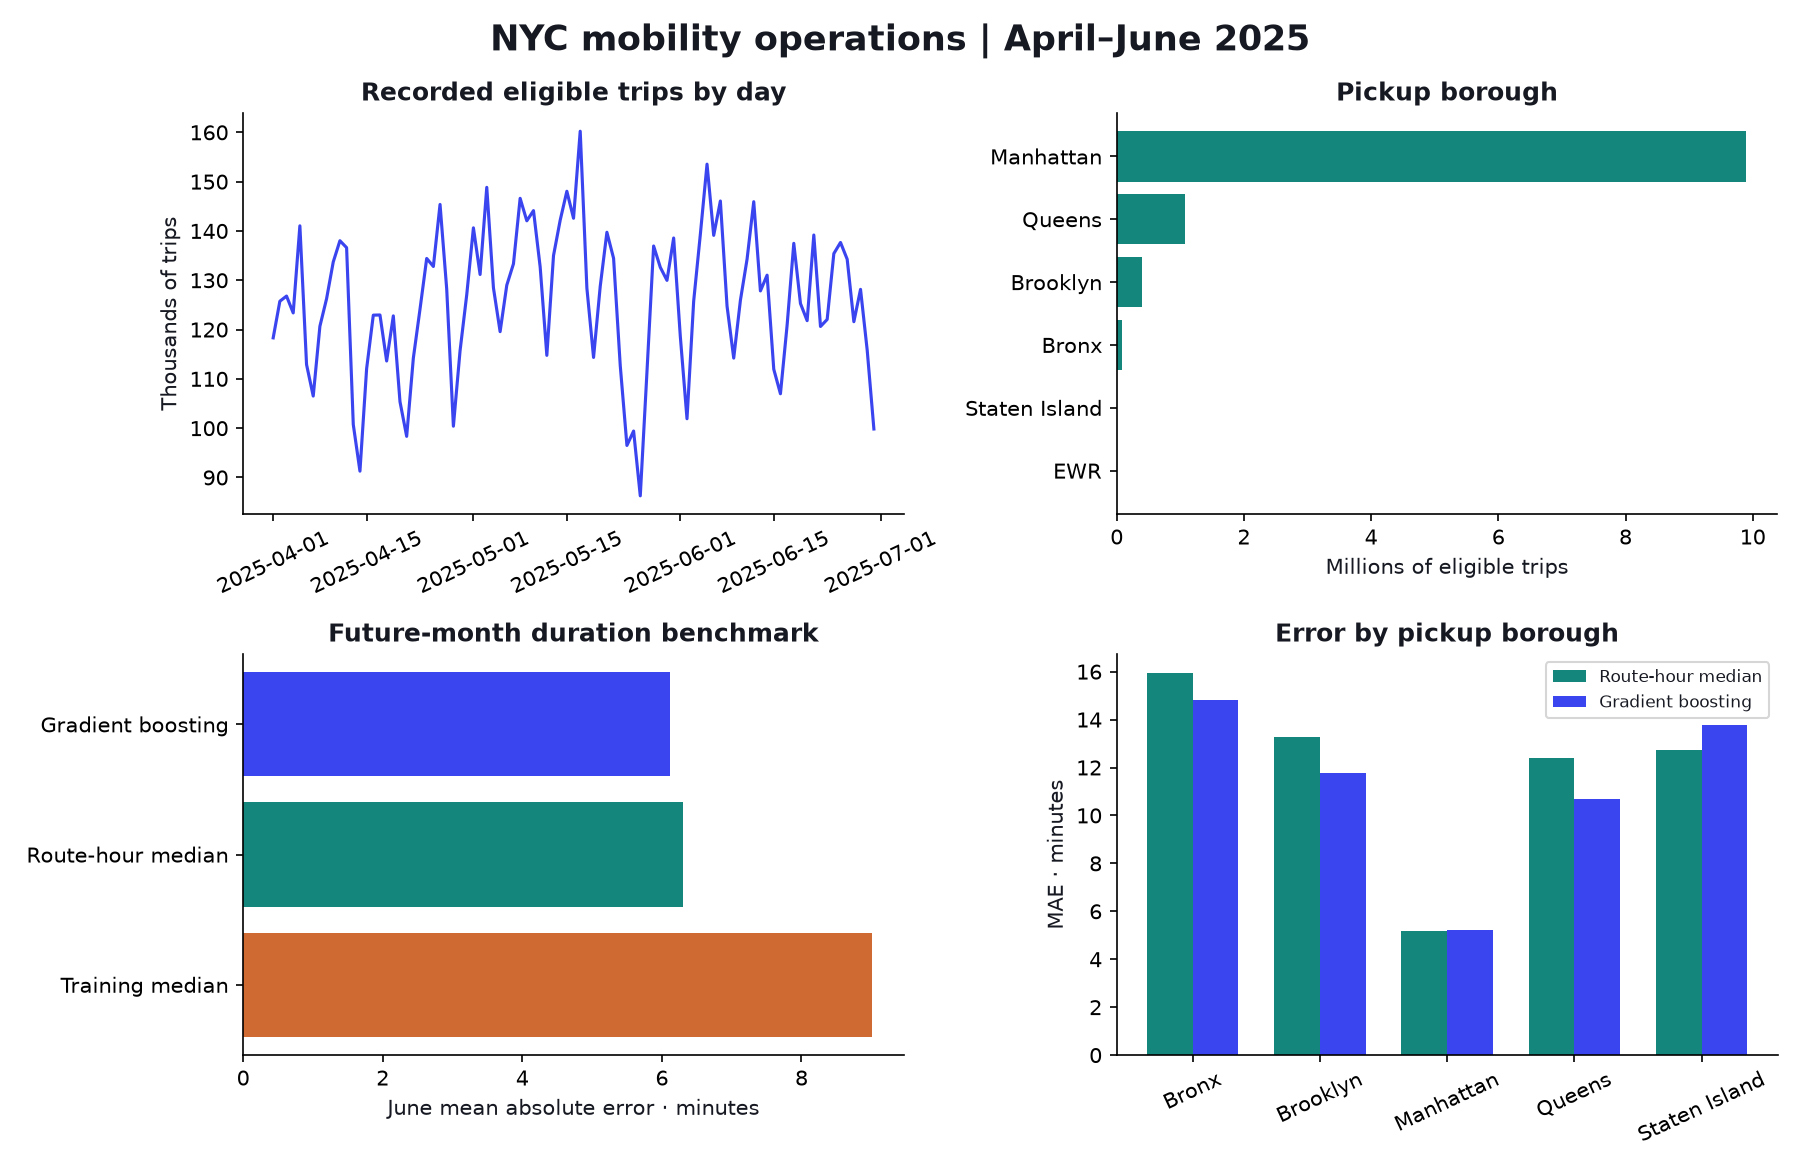
| model | test rows | mae minutes | rmse minutes |
|---|---|---|---|
| Training median | 60,000 | 9.017 | 14.32 |
| Route-hour median | 60,000 | 6.306 | 10.83 |
| Gradient boosting | 60,000 | 6.122 | 9.786 |
A complete analytical workflow
12,885,358 source observations, a reproducible SQL data mart, chronological experiments, an executed notebook, and an interactive dashboard.
Explore the results and assumptions ↗Data contract
Trip ledger: one reported trip, without an invented unique business identifier. Eligible trips: source-month pickup, 1–180 minutes, 0.1–100 miles, positive charge at most $1,000, nonnegative fare and known endpoint zones. These are analyst scope rules, not official TLC quality labels. Daily mart: one pickup date and borough. Zone mart: one month and pickup zone. The source may contain genuine identical trips; no automatic deduplication is applied.
Model decisions
Target: occupied trip minutes. Inputs: pickup zone, destination zone, pickup hour and weekday. Destination zone is assumed known at dispatch; a meter-only setting without a destination cannot use this model. Distance, fare, payment and tips are excluded because they are finalized after travel. Fixed April training and May validation precede the June test. A stronger baseline uses training route-hour medians and falls back to the global training median. Zones are integer-encoded; unseen-zone behavior and additional geometry features require a future test.
Read the operating runbook ↓Inside the Power BI project
3 editable report pages, 12 DAX measures, and a documented model with active single-direction relationships.
- Trip activity
- Charges and card payments
- Time and distance
The native report format passes Microsoft’s validator. Prepared data and model references are checked independently. Desktop refresh and rendering remain to be verified; the chart above is a Python analysis figure.
Download all DAX measures ↓Download the Power BI runbook ↓
THE METHOD
From source to answer
DuckDB warehouse over three complete monthly Parquet files; explicit eligibility ledger; date, borough and zone marts; deterministic trip samples; chronological model selection; paired daily bootstrap; native Power BI companion.
- Original monthly Parquet and taxi-zone CSV files, with retrieval hashes.
- SQL classifies every source row, preserves an exclusion ledger, and aggregates at declared grains.
- Train on April, select configuration on May, and evaluate once on June trips.
- Use trip-weighted metrics and a paired daily bootstrap; inspect borough errors.
- Serve aggregate dashboard data; keep large source files and trip-level samples outside the website.
The Python source exposes this study’s transformations. The complete project download includes shared preparation and evaluation routines.
EVALUATION
How the result was checked
April 2025 training, May validation, June untouched test; trips ending outside their source month excluded from modeling. Warehouse uses all eligible rows; models use deterministic within-month hash samples.
Configuration chosen by May MAE: HGB 31 leaves. No refitting or selection on June.
Target and input features
Target: Trip duration in minutes
Inputs: pickup_zone, dropoff_zone, hour, weekday
THE NEXT DECISION
What follows from the finding
Use the borough and month dashboard to inspect demand concentration and trip mix. Evaluate the duration model in shadow mode with dispatch data before changing service promises or fleet allocation.
Where the conclusion stops
Recorded trips do not measure unmet demand, fleet utilization, or driver earnings. Charges include fees and exclude cash tips. The model is evaluated on a bounded, deterministic sample of eligible trips and only one future month. It excludes implausible trip records. Native Power BI Desktop refresh and rendering remain unverified.
Related studies may reuse observations or holdouts. These are historical analyses; associations and backtests do not demonstrate commercial impact. Further model tuning needs new, untouched evaluation data.